FullRatio relative score
Stock Scoring System Overview
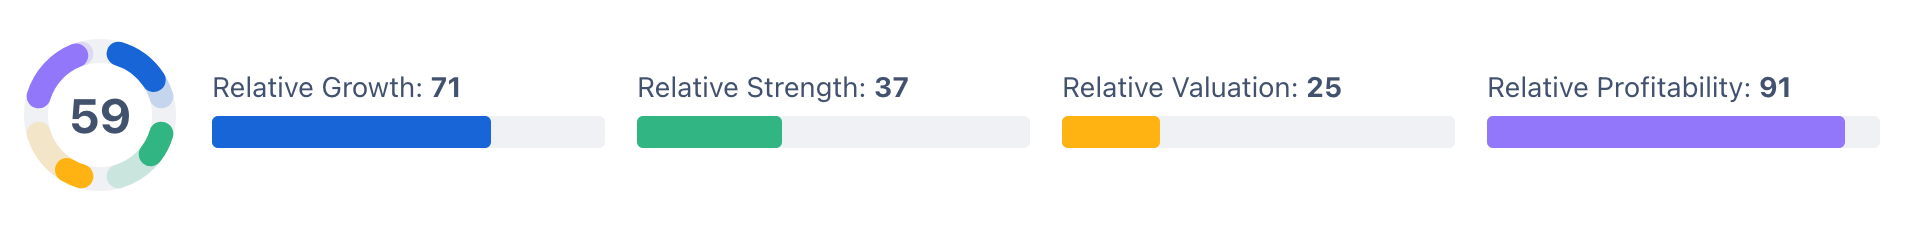
The FullRatio stock scoring system provides a comprehensive, multi-dimensional evaluation of stocks based on four key pillars: Strength, Valuation, Growth, and Profitability. Each pillar is scored independently using percentile rankings.
The scoring system uses a percentile-based approach, where stocks are ranked against all other stocks in the database. A score of 100 indicates a stock is in the top tier for that metric, while a score of 0 indicates it's in the bottom tier.
Composite Score
Purpose
The Composite Score is the top-level metric that combines all four scoring pillars into a single number from 0-100, representing a stock's overall quality across multiple dimensions.
Calculation Process
Step 1: Retrieve Component Percentiles
The system retrieves the four component percentile scores:
- Relative Strength Percentile
- Relative Valuation Percentile
- Relative Growth Percentile
- Relative Profitability Percentile
Step 2: Calculate Weighted Score
The composite score is calculated using equal weights (25% each) for all four pillars:
Composite Score = (Strength × 0.25) + (Valuation × 0.25) + (Growth × 0.25) + (Profitability × 0.25)
If any component is missing, it's treated as 0 in the calculation.
Step 3: Compute Score Percentile
The raw composite scores are then ranked against each other to generate the final composite score percentile (0-100).
1. Relative Strength Percentile
What it measures
The Relative Strength Percentile measures price momentum. It tells you how well a stock's price has been performing compared to the S&P 500 (tracked by the SPY ETF). Think of it as a measure of whether the stock is outperforming or underperforming this major market benchmark.
How it's calculated
The calculation happens in two steps. First, we compute an absolute strength score for both the stock and the S&P 500 (SPY ETF). This absolute strength is a weighted average of price changes over multiple time periods: 3-month returns, 6-month returns, 9-month returns, and 1-year returns. There is a heavier weighting on the most recent quarter emphasizing current momentum while still considering longer-term trends.
Second, we calculate the relative strength by comparing the stock's absolute strength to the market's (SPY's) absolute strength. The formula is:
((1 + stock strength) / (1 + SPY strength)) × 100
This gives us a score where values above 100 indicate the stock is outperforming SPY, and values below 100 indicate underperformance.
Finally, all stocks' relative strength scores are ranked from weakest to strongest, and converted to percentiles. A stock's percentile tells you what percentage of stocks it outperforms in terms of market-relative price momentum.
For example, if a stock has a Relative Strength Percentile of 85, it means this stock has shown better price momentum relative to the S&P 500 than 85% of all other stocks. This metric is particularly useful for identifying stocks that are in uptrends and have positive momentum behind them.
2. Relative Valuation Percentile
What it measures
The Relative Valuation Percentile evaluates whether a stock is cheaply or expensively priced compared to all other stocks in the market (all stocks in our database). A higher percentile means the stock is more attractively valued (cheaper) relative to its fundamentals.
How it's calculated
To create a comprehensive view of value, we combine four different valuation ratios, each looking at price from a different angle:
- Price-to-Earnings (P/E) Ratio is a classic measure that compares the stock price to the company's earnings per share. Lower P/E ratios generally indicate better value, as you're paying less for each dollar of earnings the company generates.
- Price-to-Sales (P/S) Ratio is useful because it compares price to revenue, which is harder to manipulate than earnings. It's particularly valuable for evaluating companies that aren't yet profitable or have volatile earnings.
- PEG Ratio (Price/Earnings-to-Growth) adjusts the P/E ratio for growth, helping identify companies that might look expensive on P/E alone but are actually reasonably priced given their growth prospects. A lower PEG suggests better value for the growth you're getting.
- EV/EBITDA (Enterprise Value to EBITDA) looks at the company's total value (including debt) relative to its EBITDA. It's useful for comparing companies with different capital structures and is less affected by accounting decisions.
Each of these four ratios is calculated and ranked across all stocks in the database, with lower values receiving higher rankings (since cheaper is better for valuation). The rankings are then weighted and combined to produce a single valuation score, which is then converted to a percentile. For example, a Relative Valuation Percentile of 75 means the stock is more attractively valued than 75% of all other stocks in the market.
This multi-factor approach ensures we're not overly reliant on any single valuation metric and provides a more robust assessment of value than any one ratio could provide alone.
3. Relative Growth Percentile
What it measures
The Relative Growth Percentile measures how fast a company is expanding its business over time. It looks at both earnings growth and revenue growth across different time periods to give you a complete picture of the company's growth trajectory. Higher percentiles indicate companies that are growing faster than all other stocks in the market (all stocks in our database).
How it's calculated
Growth is evaluated across ten different metrics that span multiple time horizons, from the most recent quarter all the way back to five-year trends. This comprehensive approach helps distinguish between companies with sustainable growth and those with just a temporary spike.
- Earnings Growth forms a key part of the score because earnings ultimately drive shareholder value. We look at earnings per share (EPS) growth in five different ways:
- the most recent quarter compared to the previous quarter
- the most recent quarter compared to the same quarter last year
- the trailing twelve months compared to the trailing twelve months for the same period one year ago
- the average annual growth over three years (CAGR)
- and the average annual growth over five years (CAGR)
The one-year trailing twelve months (TTM) growth is particularly important because it provides the most current full-year picture while smoothing out quarterly volatility. The three-year and five-year averages help demonstrate sustained growth rather than just a good year or two.
- Revenue Growth complements the earnings picture and is evaluated in parallel:
- the most recent quarter compared to the previous quarter
- year-over-year quarterly growth
- trailing twelve months year-over-year growth
- three-year average annual growth (CAGR)
- and five-year average annual growth (CAGR)
While earnings growth is emphasized more heavily, revenue growth is still important because consistent revenue growth often precedes earnings growth and can indicate a company's competitive position and market opportunity.
Each growth metric is ranked across all stocks in the database, with higher growth rates receiving higher rankings. These ten rankings are then combined to produce a single growth score, which is converted to a percentile. A Relative Growth Percentile of 80 means the company is growing faster than 80% of all other stocks, considering both short-term momentum and long-term consistency.
4. Relative Profitability Percentile
What it measures
The Relative Profitability Percentile evaluates how efficiently and profitably a company operates compared to all other stocks in the market (in our database). It answers the question: "How good is this company at converting its business activities into profits?" Higher percentiles indicate companies that are more profitable and efficient.
How it's calculated
Profitability is assessed using five different metrics, providing a balanced view across different dimensions of profit generation and capital efficiency.
- Gross Margin measures profitability at the product or service level. It shows how much profit a company makes after paying for the direct costs of producing what it sells. Companies with strong gross margins have more flexibility to invest in growth and weather difficult times.
- Operating Margin looks at profitability from core business operations after accounting for all operating expenses like salaries, rent, and marketing. High operating margins suggest a well-run company with good cost control and operational efficiency.
- Return on Equity (ROE) measures how effectively the company uses shareholder money to generate profits. Higher ROE indicates the company is efficiently deploying shareholder capital to create value.
- Return on Invested Capital (ROIC) is similar to ROE but looks at all capital invested in the business, including both equity and debt. Companies with high ROIC are excellent at generating returns on all the money invested in them, making them particularly attractive investments.
- Net Income Growth (YoY TTM) captures the trajectory of recent profitability. While the other four metrics measure current profitability levels, this metric shows whether those profits are growing or shrinking. A company with strong margins and returns that are also growing is particularly compelling.
Each of these five metrics is ranked across all stocks in the database, with higher values receiving higher rankings. The five rankings are then combined to produce a single profitability score, which is converted to a percentile. A Relative Profitability Percentile of 85 means the company is more profitable and efficient than 85% of all other stocks.
How to Read the Score
| Score | Meaning |
|---|---|
| 90-100 | Ranks near the top of the market for that metric |
| 70-89 | Strong relative ranking |
| 40-69 | Middle of the pack |
| 0-39 | Weak relative ranking |
Disclaimer
The FullRatio stock scoring system is designed as an analytical tool to help investors evaluate and compare stocks based on fundamental and technical metrics. This score is not intended to be financial advice and does not indicate future price movement. Always consult with a qualified financial advisor before investing.