The Buffett Indicator
The Buffett Indicator, also known as the Market Cap to GDP ratio, is a metric used to evaluate whether the stock market is overvalued or undervalued. The Buffett Indicator is calculated by dividing the total market capitalization of all publicly traded companies in a particular market by the country's gross domestic product (GDP). The resulting ratio provides an indication of whether the market is overvalued or undervalued relative to the overall size of the economy. The ratio is calculated as:
Buffett Indicator = US Market Value / Annualized US GDP
Current and Historical Trends
The historical trends of the Buffett Indicator can provide insight into the overall health of the market. A lot of investors and the financial media widely uses it as a valuation measure for the US market, both in its absolute form and in a de-trended version.
"Detrending" time series data refers to the process of eliminating an underlying trend from the data. The purpose of detrending is to facilitate the identification of seasonal or cyclical subtrends within the data.
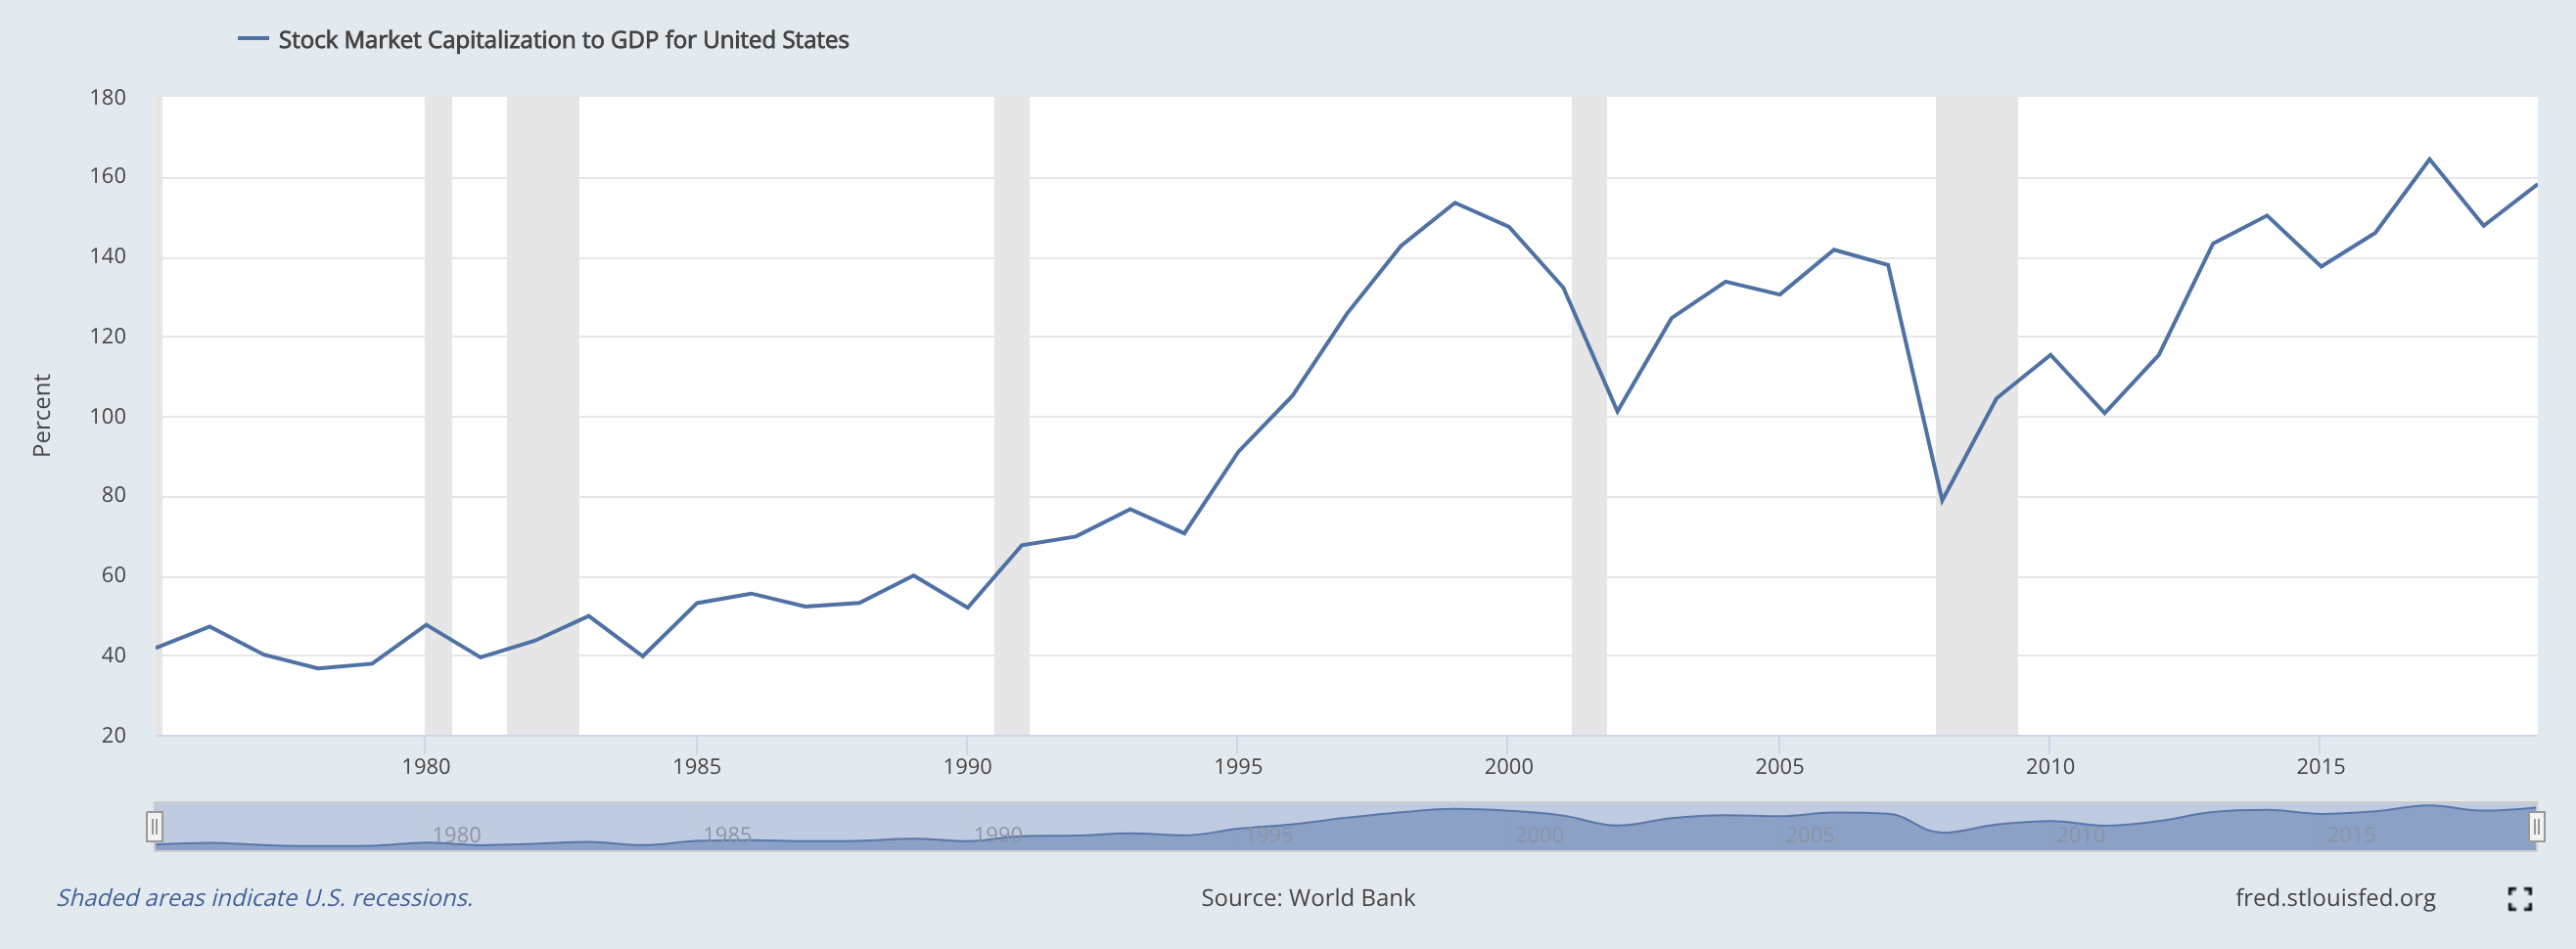
During periods of economic growth, the ratio tends to be higher, while during recessions, the ratio tends to be lower. For example, the Buffett Indicator reached an all-time high of 148% in early 2021, which some experts have interpreted as a sign that the stock market is overvalued.
Data and calculation
Total Market Value
The Wilshire 5000 is the most commonly used measurement for the total value of the US stock market. It can be accessed directly from Wilshire with monthly data available since 1971 and daily measures since 1980.
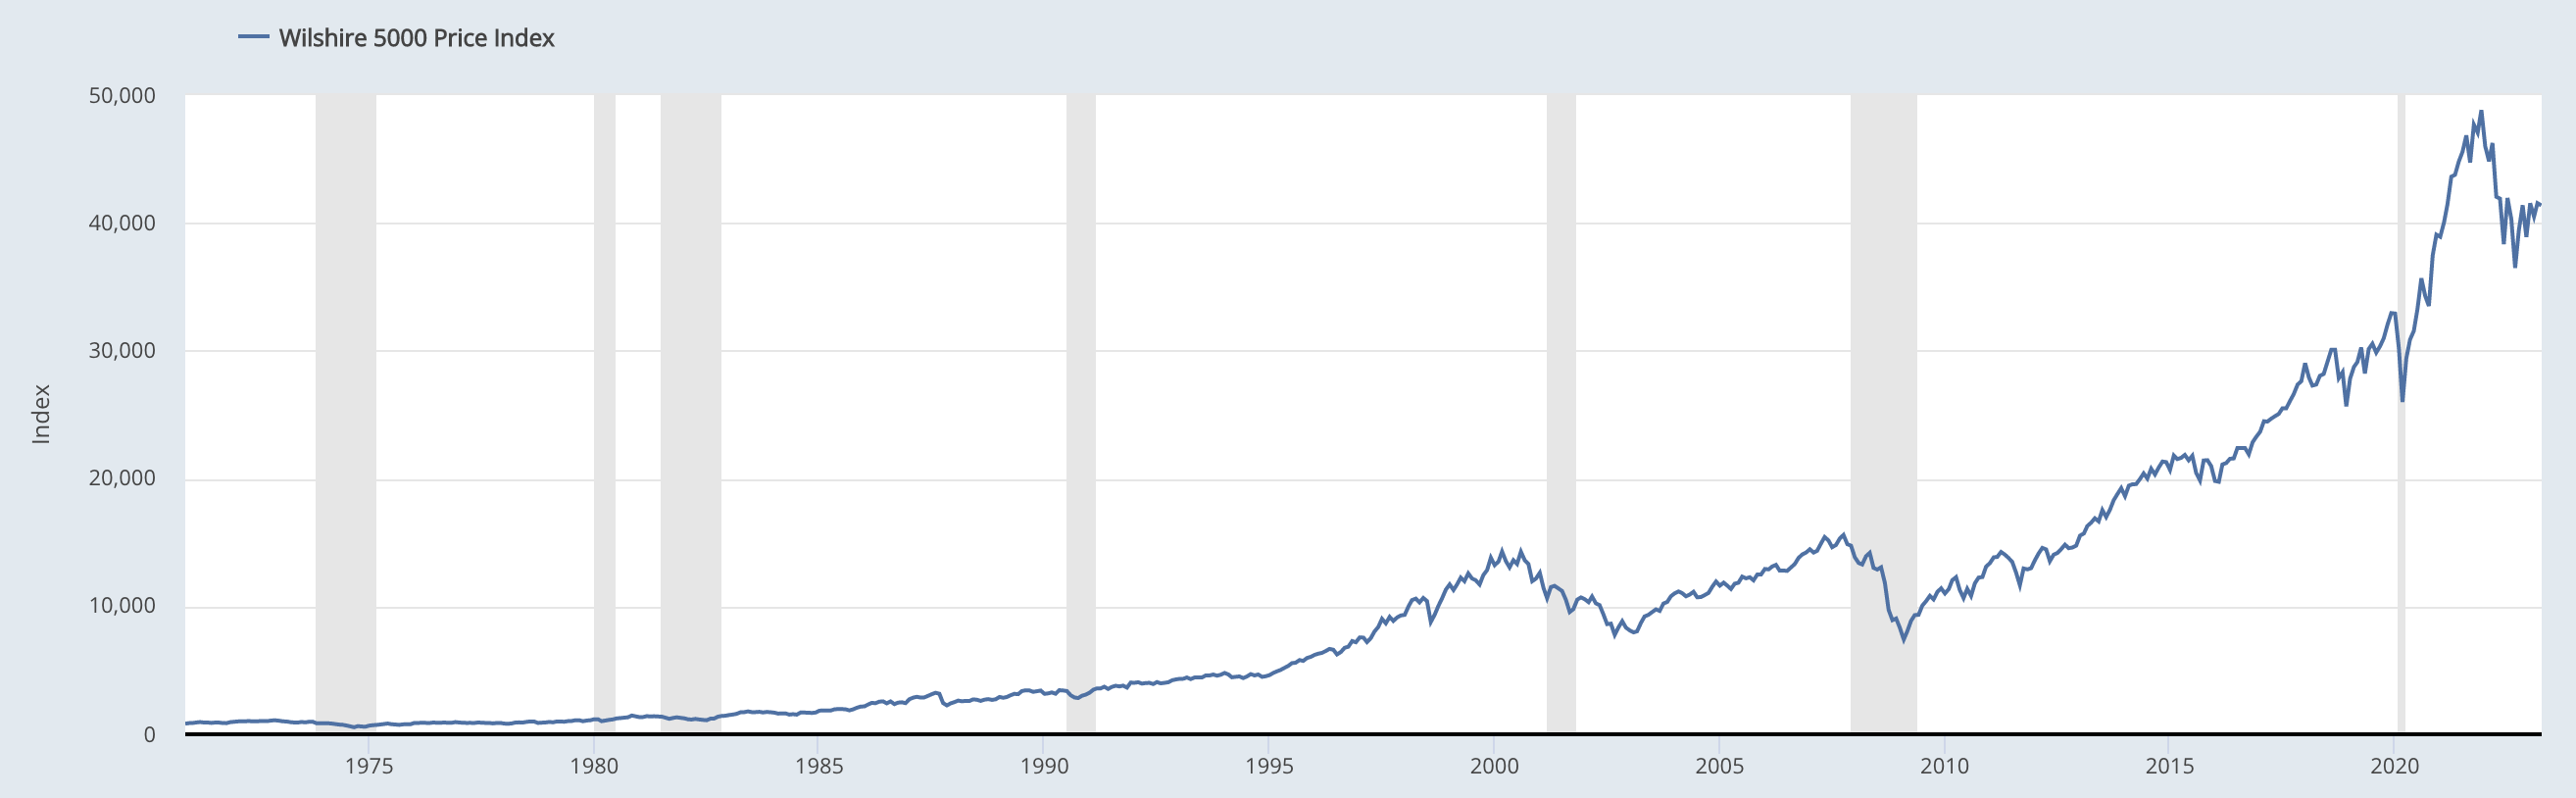
Each point increase in the index represents a $1 billion increase in US market cap, although as of 2020, this ratio has slightly drifted to $1.05 billion. Prior to 1970, the Z.1 Financial Account - Nonfinancial corporate business; corporate equities; liability, Level, published by the Federal Reserve, is the best source for total market value estimates, with quarterly data available back to 1945. Combining these data sources shows that the current estimated value of the composite US stock market is $42.25 trillion.
GDP
The US Government's Bureau of Economic Analysis measures the Gross Domestic Product (GDP) quarterly, which represents the total annual production of the US economy. It is a static measurement of past economic activity and does not forecast or value future economic growth.
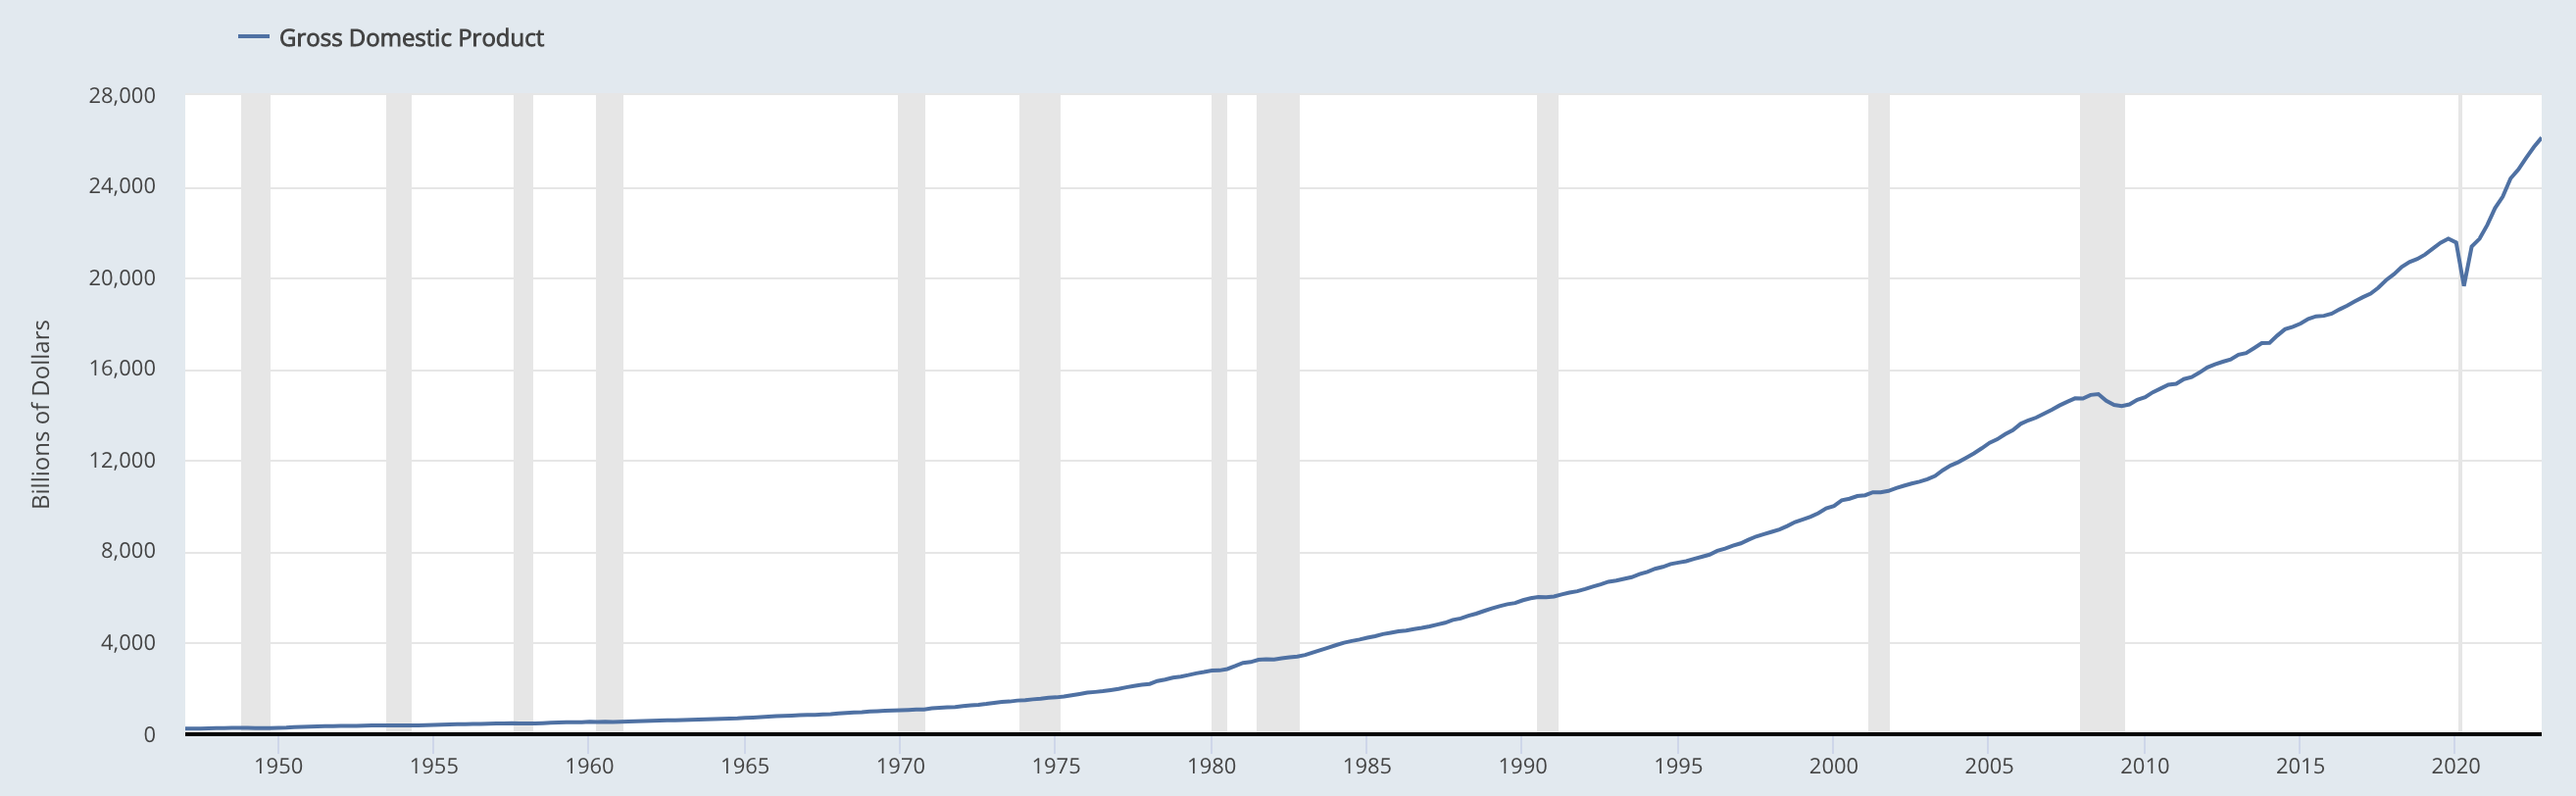
The GDP data is published several months in arrears, and the Federal Reserve Bank of Atlanta publishes GDPNow, an estimate of the current quarter's GDP growth rate, which can be used to calculate an estimate for the current month's GDP value. A historical chart of GDP is available below.
Interpretation
The result of this calculation is the percentage of GDP that represents stock market value. A ratio greater than 100% is considered to indicates overvaluation, while a value around 50%, which is close to the historical average for the US market, suggests undervaluation.
A ratio between 50% and 75% indicates modest undervaluation, while a ratio between 75% and 90% suggests fair valuation. A ratio between 90% and 115% indicates modest overvaluation. However, determining the accurate percentage level for undervaluation and overvaluation is still debated, as the ratio has been trending higher over time. The World Bank provides data on the Stock Market Capitalization to GDP ratio for the world, which was 92% in 2018.
Buffett in his Forbes magazine essay gave is interpretation of the ratio: "For me, the message of that chart is this: If the percentage relationship falls to the 70% or 80% area, buying stocks is likely to work very well for you. If the ratio approaches 200%–as it did in 1999 and a part of 2000–you are playing with fire".
In May 2022, two European academics conducted a study examining the predictive value of the Buffett Indicator in fourteen developed markets outside the US over ten-year periods, starting from 1973. The study found that the Buffett Indicator explained a significant portion of the ten-year return variation in most countries, with an average predictive value of 83% across all nations and periods. However, the accuracy of the indicator varied depending on the specific nation, ranging from a low of 42% to as high as 93%. The study also noted that the accuracy was lower in nations with smaller stock markets.
When interpreting the Buffett Indicator, it's important to consider other factors such as interest rates and inflation. A high ratio may indicate that the stock market is overvalued and due for a correction, while a low ratio may suggest that the market is undervalued and could present buying opportunities. However, investors should be cautious not to rely solely on the ratio and should always conduct further research before making investment decisions.
It's named after Warren Buffett, who popularized the use of this ratio as a measure of stock market valuation. Buffett has described this ratio as "probably the best single measure of where valuations stand at any given moment." However, it is important to note that the ratio is not infallible and should be used in conjunction with other valuation metrics and market analysis to make investment decisions.
Criticisms and Limitations
While the Buffett Indicator can be a helpful tool for investors, it's important to recognize its limitations.
Interest rates and inflation
One criticism of the Buffett Indicator is that it doesn't take into account changes in interest rates or inflation, which can have a significant impact on stock prices. High interest rates decrease the demand and prices of stocks while making it difficult for businesses to borrow money for growth, leading to lower corporate profits and stock values. Conversely, low interest rates increase the demand and prices of stocks while making it easier for corporations to borrow cash for growth, resulting in higher corporate profits and stock values. Therefore, it can be concluded that stock prices are inversely related to interest rates; when interest rates are high, stock prices tend to go down, and when interest rates are low, stock prices tend to go up.
International stocks
The Buffett Indicator has been criticized for not taking into account international activity in the stock market valuation, which GDP does not reflect. This can lead to a higher Buffett Indicator value since the numerator (total stock market value) is increasing while the denominator (GDP) remains unchanged. With globalization, this could further increase the volatility of the Buffett Indicator value, especially for smaller, non-US countries with a smaller stock market dominated by large international firms. However, the valuation model presented here considers the exponential growth trend line of the Buffett Indicator itself, with a "fair" value of 50% in 1960 and ~120% in 2020, due to factors such as technological advances and the rise of international sales of US-based firms. The model looks at relative performance against the indicator's own trend rate, rather than solely relying on a high or low value of the Buffett Indicator.
Additionally, the ratio can be misleading in certain situations, such as when the stock market is dominated by a few large companies.
Applications
Despite its limitations, the Buffett Indicator can be a valuable tool for investors when used in conjunction with other metrics and analysis. The ratio can help investors identify long-term trends in the stock market and determine whether stocks or other assets are overvalued or undervalued. For example the World Bank's statistics in 2000 showed that the US had a market cap to GDP ratio of 153%, indicating an overvalued market. The market subsequently experienced a sharp decline following the burst of the dotcom bubble, suggesting that the ratio may have some predictive value in signaling market peaks. However, in 2003, the ratio remained overvalued at around 130%, yet the market continued to reach all-time highs over the following years. Currently, as of 2020, the ratio stands at approximately 150%.
Conclusion
In conclusion, the Buffett Indicator is a valuable tool for investors looking to make informed investment decisions in the stock market. By providing insight into whether the market is overvalued or undervalued relative to the overall size of the economy, the ratio can help investors identify potential risks and opportunities. However, investors should always conduct further research and analysis before making investment decisions, and should consider the current economic climate and other factors that may impact the stock market.
Data source: FRED Economic Data